
Taking the train instead of flying will usually cut the emissions from a short journey by around 85% to 95%, where both are realistic options. London to Edinburgh produces about 12.5kg CO₂e per passenger by train and 165.1kg by plane. London to Paris comes out at 2kg CO₂ by rail and 61.5kg by air.
Looking at those figures, I would choose the train whenever there is a direct service that works in terms of time and cost. Whether rail is 85% or 95% lower would not change my choice. Several changes, an overnight stop, poor accessibility or a huge difference in price might.
When there is no realistic train, the choice is usually the car, and that one is much closer. I have compared flying vs driving emissions on the same 2026 Government factors.
Train vs plane emissions at a glance
| Journey | Train | Plane | Saving by rail |
|---|---|---|---|
| London to Edinburgh | 12.5kg CO₂e | 165.1kg CO₂e | 92% |
| London to Paris | 2.0kg CO₂ | 61.5kg CO₂ | 97% |
| London to Brussels | 2.6kg CO₂ | 68.1kg CO₂ | 96% |
| London to Amsterdam | 3.9kg CO₂ | 70.9kg CO₂ | 95% |
Reading this for work?
Business travel is rarely the biggest number in a company’s carbon footprint. C Level has spent 25 years measuring the bigger ones, and showing where the figures come from.
Carbon footprint consultancyWant to put something back?
You can fund forest restoration with the Khasi people of Meghalaya, from £10. The panel is further down this page.
How much lower are train emissions in Britain?
On seven British routes where rail and air are realistic alternatives, taking the train produced 85% less CO₂ per passenger on average. The July 2026 study reported a saving of just over 100kg CO₂e per passenger journey.
That is the clearest current British answer I found, and I think 85% is a fair shorthand when talking about those sorts of direct domestic routes. I would not turn it into a fixed factor for every train in Britain. A busy electric service is not the same as a quiet diesel one, and the flight side changes with the aircraft and how full it is. The rail industry also paid for the study, so there is no reason to make the claim any broader than the evidence allows.
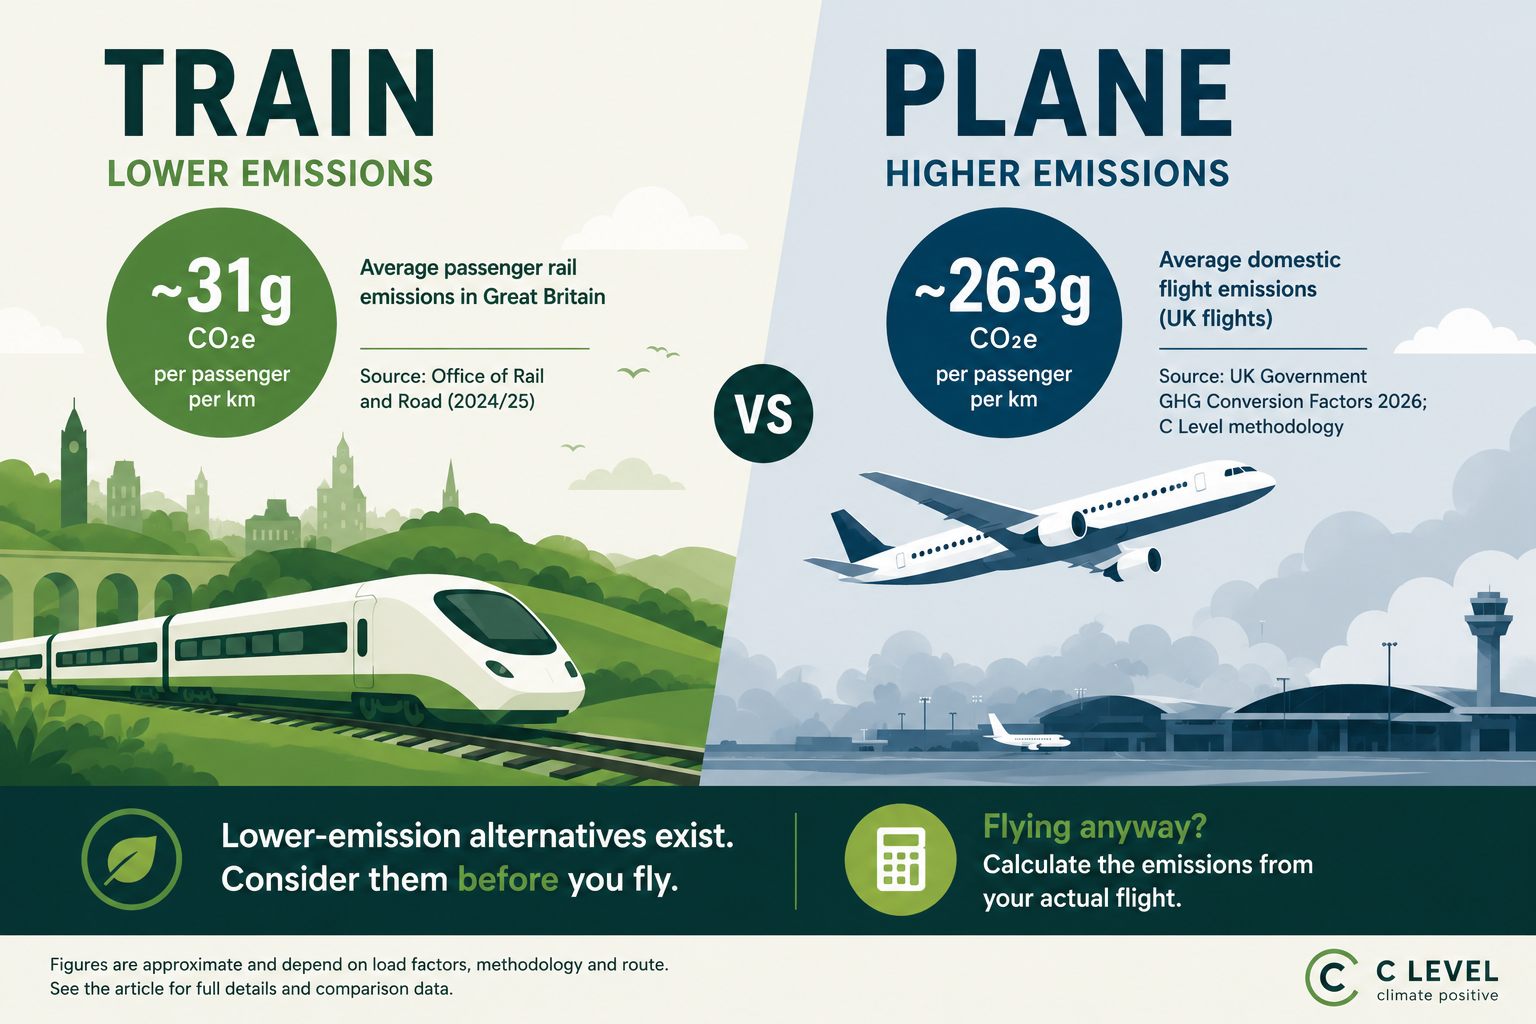
The Office of Rail and Road puts average British passenger train emissions at 31g CO₂e per passenger-kilometre.
Rail’s advantage over flying is not the same size as its advantage over driving. That one turns on the car’s fuel and the number of people in it, and I have set out train vs car carbon emissions on the same 2026 Government factors.
Why is flying so much worse?
Flying produces so much more because an aircraft uses a great deal of fuel getting off the ground, and that initial burn makes up a large part of a short journey. A plane begins every flight by lifting itself, its passengers, their luggage and its fuel into the air.
A train spreads its energy use across hundreds of passengers and never has to leave the ground. Electric services also become cleaner as the grid does, without the train operator having to replace the entire fleet.
That does not mean every train performs well. A nearly empty diesel service will look much worse per passenger than a busy electric intercity train, and there will be unusual routes on which rail loses much of its advantage. I just do not think that is a sensible starting assumption for London to Edinburgh, Paris or Brussels.
Why do published comparisons disagree?
Published comparisons disagree because they count different gases, draw the journey boundary in different places and treat aviation’s effects at altitude differently. That is how one page can say the train is five times better while another says more than thirty, even though both point towards the same travel choice.
Some studies report carbon dioxide alone, while others include the other greenhouse gases and express the result as CO₂e. Some include the emissions from producing and transporting fuel or electricity before the journey begins. The treatment of aviation’s extra warming effects at altitude can make another substantial difference.
A traveller does not need to resolve every one of those questions before booking a ticket. Where I would be more careful is in a company report or travel policy. Taking the rail figure from one methodology and the flight figure from another can create an impressive-looking comparison that does not really hold together. I would look for one study that calculates both sides on the same basis.
The extra warming from flying at altitude
Aircraft affect the climate through contrails, nitrogen oxides, water vapour and other processes as well as carbon dioxide. The exact impact is uncertain, but pretending it is zero gives the flight an answer that is almost certainly too low.
When we built our Flight Carbon Calculator, we had to decide what to do with that uncertainty. The UK Government recommends 1.7 as its central multiplier, so that is what we use. I would rather use an imperfect central estimate and explain the choice than leave a known effect out because it makes the calculation tidier.
London to Edinburgh: the clearest British case
Taking the train from London to Edinburgh saves roughly 153kg CO₂e per passenger each way, based on published figures of 12.5kg by rail and 165.1kg by air. It is the British comparison I keep coming back to because neither option is theoretical. People regularly make the journey both ways, and the train runs from one city centre to the other.
We can argue about load factors or exactly where the journey boundary begins, but we are not going to argue away a difference of that size.
The timetable makes the train look slower. The lived journey is less clear-cut. Flying adds the trip to the airport, the wait before departure and another journey into Edinburgh. Four hours on a train can also be working or reading time in a way that four broken pieces of a flight rarely are.
If I were writing a business travel policy, I would still leave room for exceptions. A badly timed meeting, disability, caring responsibilities or a large fare difference may change what is reasonable for a particular person on a particular day. Even with those allowances, I would make rail the normal choice for this route.
Eurostar vs flying
For London to Paris, I struggle to see a carbon case for flying. The published comparison is 2kg CO₂ by train against 61.5kg by air. Brussels and Amsterdam land in much the same place, with rail between 95% and 96% lower.
Eurostar commissioned these figures, so they are not disinterested. The result is still hard to dismiss. It is consistent across all three routes and the gap is enormous before anyone adds the airport journeys.
In practice, convenience may settle this before carbon does. St Pancras to Gare du Nord puts you where you want to be. A flight means travelling out of one city, passing through an airport and travelling back into another.
Is the train always greener than flying?
For a direct intercity journey, the train will almost always be greener, although it is possible to construct an exception involving a nearly empty diesel train, a large detour, several changes and a very full, efficient aircraft. I do not think that exception tells us much about how to travel between cities with a straightforward rail connection.
What can overturn my recommendation is the journey itself. If rail adds an overnight stay, costs several times more or makes the trip inaccessible, flying may be the reasonable choice. Carbon matters, but it is not the only constraint people live with.
Is the train cheaper and quicker too?
Rail is often cheaper once the whole journey is counted, but I am not convinced it is generally quicker. The 2026 British study found rail was 71% cheaper across its seven routes after airport transfers, baggage and seat charges were included. The average saving was £147. On London to Edinburgh, the train fare actually paid averaged £64, while the full cost of flying was almost three times as high.
The claim that rail is quicker feels more stretched. The study says passengers gain about three usable hours, but that assumes 93% of the train journey can be used productively and includes a two-hour airport arrival. That may describe my day or yours. It is not the same as proving that every train journey is faster.
The carbon case does not need that extra salesmanship. Compare the door-to-door time, cost and number of changes for the journey in front of you. If rail still works, the emissions saving is clear.
What I would put in a business travel policy
I would make rail the normal choice for business journeys of four or five hours, with sensible exceptions for cost, accessibility, caring responsibilities and poor connections. I would not make employees write an essay to justify those exceptions. The purpose is to change the routine choice, while accepting that people’s lives do not always fit neatly around a policy.
Business travel appears in Scope 3 Category 6 of the GHG Protocol. It is also part of the travel reporting required from companies covered by UK government Carbon Reduction Plan rules, so the policy feeds directly into the figures many organisations already have to produce.
This is one of the few emissions reductions a company can make at the moment of purchase. There is no new technology to wait for. Somebody books the train rather than the flight, and the reduction has happened.
What if you still need to fly?
If rail is not a serious option, flying may be the reasonable decision. I do not think people should be made to feel that every necessary flight is a personal failure.
What matters then is measuring the flight properly, including the route and cabin class, and being honest about the result. Buying a carbon credit does not make the journey disappear. Our order is to avoid what can reasonably be avoided, reduce what can be reduced, calculate what remains and only then decide how to take responsibility for it.
The Flight Carbon Calculator will calculate the journey you are taking. If you then want to support climate action, our guide to choosing high-integrity carbon credits explains what we look for.
Once you have the number, this is offsetting a flight properly, and what to check before you pay for a carbon credit.
Train vs plane carbon emissions FAQs
There is no fixed multiplier. Recent route comparisons put rail between 85% and 97% lower. The exact figure matters less than using a comparison in which both journeys were calculated the same way.
Yes. On the published London routes to Paris, Brussels and Amsterdam, Eurostar produces around 95% to 97% less CO₂ per passenger.
Take-off and climbing burn a lot of fuel. On a short route, that initial burn makes up a large part of the journey.
Yes. The aircraft’s emissions are divided between more people. Standard conversion factors usually account for this through an average passenger load.
No. They use electricity, and generating electricity has a carbon cost. Their emissions generally fall as the grid becomes cleaner.
Because leaving them out is likely to understate the flight. We use the UK Government’s central estimate and show that choice in the calculation.
Sources and methodology
Transport figures change as grids, trains, aircraft and government methods change. The sources are dated so the comparisons can be checked and updated.
- Department for Energy Security and Net Zero. UK Government Greenhouse Gas Conversion Factors for Company Reporting 2026, and the methodology published alongside them. June 2026. View the publication.
- Office of Rail and Road. Rail Environment statistics for Great Britain, including passenger train emissions for each passenger-kilometre. The 31g figure comes from the 2024/25 release. View the statistics, or view the release.
- Rail Delivery Group. Green Travel Data, updated April 2026. View the data.
- Steer, for Rail Delivery Group. Clearing the Air, July 2026. Steer carried out the research and Rail Delivery Group commissioned it. View the research.
- European Environment Agency. Its comparison of passenger transport and emissions for each passenger-kilometre. View the comparison.
- GHG Protocol. Category 6, Business Travel, in chapter 6 of the Technical Guidance for Calculating Scope 3 Emissions. View the guidance.
- Eurostar and EcoRes. Eurostar’s sustainability figures, based on research by EcoRes SCRL, November 2024. View the figures.
- Rail Delivery Group. The Green Travel Pledge, including the London to Edinburgh figures, June 2023. View the pledge, or view the announcement.